> ## Documentation Index
> Fetch the complete documentation index at: https://private-7c7dfe99-sync-clickhouse-operator-docs-7e82242.mintlify.site/llms.txt
> Use this file to discover all available pages before exploring further.
# Operational Guide
### Enabling Feature Flags
To enable feature flags on the cluster, you can edit the `clickhousecluster` resource directly and update/add the values under `spec.featureFlags`. Note that changing some feature flags may initiate a rolling restart of the cluster.
### Backups on ClickHouse Private
#### Prerequisites
* An S3 bucket created in the same region as your cluster
* The IAM role tied to the Kubernetes service account must have read, write, list access to this bucket
* Two [feature flags must be enabled](#enabling-feature-flags) (set to `true`) on your cluster: `userInitiatedBackupsEnabled` and `enableUseEnvironmentalCredentialsByDefault`
#### Performing a Backup
From one of the server pods, you can run the following command to issue a backup job in the background:
```
BACKUP TABLE system.users, TABLE system.roles, TABLE system.settings_profiles, TABLE system.row_policies, TABLE system.quotas, TABLE system.functions, ALL EXCEPT DATABASES INFORMATION_SCHEMA,information_schema, system TO S3('https://s3.$REGION.amazonaws.com/$S3_BUCKET/$CLUSTER_S3_PREFIX/$BACKUP_ID') SETTINGS id='$BACKUP_ID' ASYNC;
```
* `$REGION` is the S3 region, eg `us-west-2`
* `$S3_BUCKET` is the name of the S3 bucket created to hold the backups
* `$CLUSTER_S3_PREFIX` is the S3 key prefix of the cluster (should be distinct per cluster) when the cluster was created. You can retrieve this from the `clickhousecluster` resource of your cluster under `spec.s3.keyPrefix`. It should be something like `ch-s3-{uuid}`
* `$BACKUP_ID` is a unique identifier for the backup being taken. You can use any UUID for this value.
##### Backup Status
Once the backup command above is issued, it will run in the background asynchronously. You can check the status by querying the `system.backups` table for the id you provided. **It's important to verify that the `status` field is not in some error state**. If it is, the backup has failed and will need to be reissued once the underlying error is resolved. Querying this table will also tell you when the backup has successfully completed.
##### Incremental Backups
You can also perform incremental backups where a previous backup is used as a starting point as to avoid recopying the same data on each backup. You can read more about it here: [https://clickhouse.com/docs/operations/backup#take-an-incremental-backup](/core/reference/engines/database-engines/backup#take-an-incremental-backup).
#### Restoring from a Backup
To restore from a backup, run the command below in the cluster that you want to restore into:
```
RESTORE ALL FROM S3('https://s3.$REGION.amazonaws.com/$S3_BUCKET/$CLUSTER_S3_PREFIX/$BACKUP_ID') SETTINGS id='$RESTORE_ID', allow_different_database_def=true;
```
The variables above are the same as the ones used when creating the backup. `$RESTORE_ID` is any unique identifier you want to give this restore operation.
### Operator
#### Overview
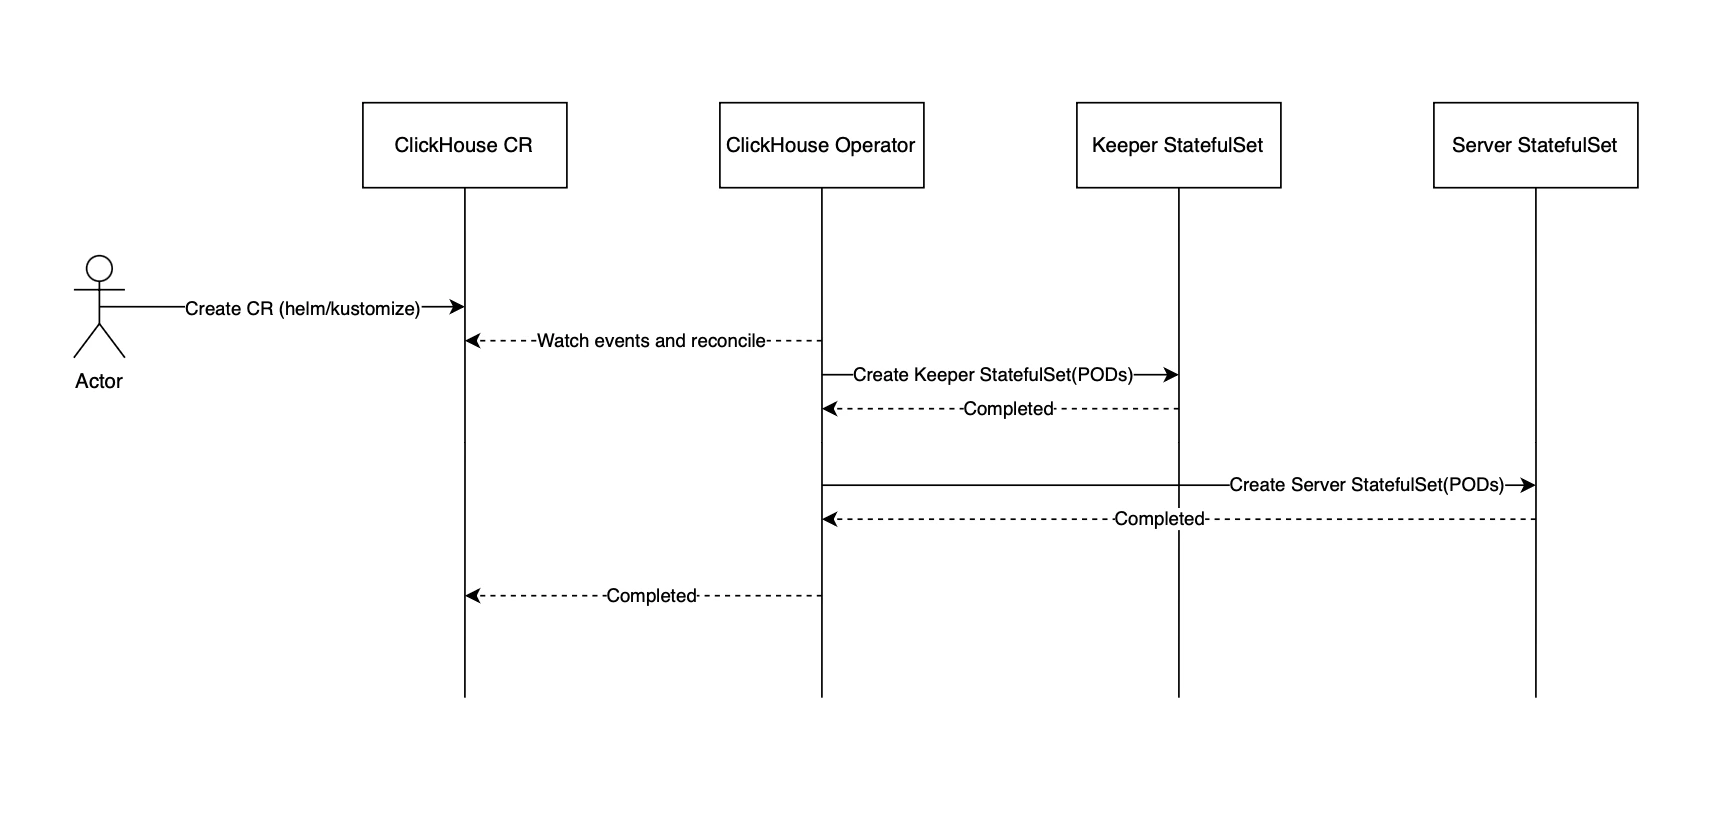
The clickhouse-operator is responsible for the provisioning and reconciliation of the registered clickhousecluster custom resources and cluster lifecycle, including:
* deploying and terminating server and keeper components
* controlling cluster state (running/stopping/etc.)
* processing backup requests
* cleaning PVCs
* horizontally scaling cluster
#### Architecture
##### Instance Lifecycle
 ##### MultiStatefulSet (aka MultiSTS)
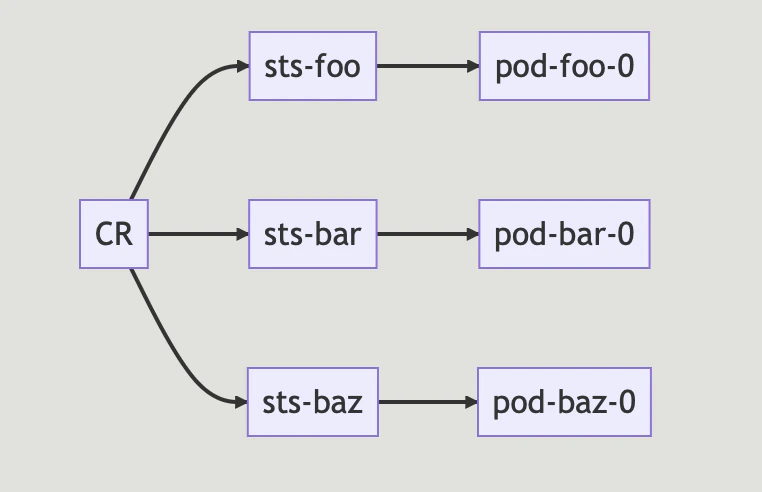
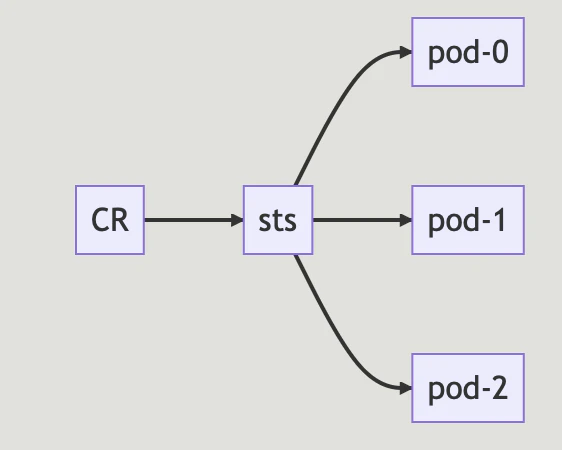
MultiStatefulSet is a feature of the clickhouse-operator which enables the clickhouse server pods to run with 1 StatefulSet being the owner of only 1 Clickhouse Server Pod (aka a Replica). This is different from SingleSTS in the sense that within SingleSTS, 1 Statefulset owns all replicas.
**SingleSTS**
This is how a Single StatefulSet looks like:
##### MultiStatefulSet (aka MultiSTS)
MultiStatefulSet is a feature of the clickhouse-operator which enables the clickhouse server pods to run with 1 StatefulSet being the owner of only 1 Clickhouse Server Pod (aka a Replica). This is different from SingleSTS in the sense that within SingleSTS, 1 Statefulset owns all replicas.
**SingleSTS**
This is how a Single StatefulSet looks like:
 **MultiSTS**
By contrast, pods running in MultiSTS look like the following:
**MultiSTS**
By contrast, pods running in MultiSTS look like the following:
 ###### ReplicaStateMap - How multiple statefulsets are tracked
MultiSTS replicas cannot rely on ordinals as a deterministic way to understand a pod's age / lifecycle. Because we need a way to track the state of each statefulset, we store this inside a map as part of the CR's status.
A sample replicaStateMap can look like following:
```
❯ kubectl get clickhousecluster c-navy-wl-64 -o yaml | yq .status
replicaStateMap:
c-navy-wl-64-server-5hvvzxe:
createdAt: "2023-08-03T13:25:40Z"
isBackupPod: true
state: Pending
updatedAt: "2023-08-03T13:25:40Z"
c-navy-wl-64-server-fvnytjb:
createdAt: "2023-08-03T13:25:40Z"
state: Pending
updatedAt: "2023-08-03T13:25:40Z"
c-navy-wl-64-server-un85gpo:
createdAt: "2023-08-03T13:25:40Z"
state: Pending
updatedAt: "2023-08-03T13:25:40Z"
```
* The state can be **Pending**, **Ready**, **Stopped** or **Condemned**.
* ReplicaStateMap also marks 1 pod at any given time as the pod for which **IsBackupPod** will be true. Predictably, this pod is where backup will run.
* A **backup** replica is never marked as **Condemned**
* Once a replica's name gets added to the map, the operator will ensure it goes from **Pending** to **Ready** state.
*WARNING: Additionally, the state tracking built inside the map is only for the operator's internal state management and should not be used by external components.*
###### Parallel vs Rolling Reconciliation
The operator will do Parallel Pod Management if the only change in StatefulSet spec has to do with changing replica count.
If the statefulset specs require something other than resizing of replica count, then we no longer rely on parallel pod management. A second upgrade loop kicks in.
The upgrade loop will look at the PDB (maxUnavailable) and start reconciling statefulsets one-by-one. It will ensure we never exceed the disruption budget.
###### Horizontal Scaling in MultiSTS mode
Scaling Out in MultiSTS mode is simple. As soon as a new replica name gets added to the ReplicaStateMap, the operator will ensure that StatefulSet gets created and reconciled. Subsequent reconcile loops will ensure that the newly created replica is up-to-date.
Scaling In is quite involved and complex. Because a replica which is caling in might still be receiving traffic, we follow multiple steps to ensure the replica scales in.
**Condemned Replicas**
We introduce the concept of a Condemned Replica. When the actual replica count has exceeded the desired count, it means we need to scale in. The replicas that get marked for deletion are **condemned** replicas. We change their state from **Ready** to **Condemned** inside the **ReplicaStateMap**. This ensures that further down the line, we remember which replicas we need to safely delete and remove from the map.
**Scale-In**
Now that we understand condemned replicas, here is the flow of Scaling In:
1. Remove the Topology Key (so this replica is no longer part of our TopologySpreadConstraint's Skew calculations).
2. Make sure all statefulsets are in **Ready**. If not, we will not scaleIn (and continue to re-queue).
3. Execute **SYSTEM SYNC REPLICA** $database.$table LIGHTWEIGHT for each replicated db for each table. *Note: This command is executed on the replica marked for backups (since that replica is never condemned).*
4. **Delete** the **condemned statefulsets**, and remove them from the ReplicaStateMap.
5. Execute **SYSTEM DROP REPLICA** \$replicaName on Ready replicas to remove their information from Keeper.
*Note: Because we have removed replicas from ReplicaStateMap, we query ClickHouse to get the set of all known replicas and only then drop the ones we need to.*
*Label the PVCs for the deleted statefulsets with clickhouse.com/delete-pvc. This is PVC Leaking.*
*This is where the operator's responsibility ends and the PersistentVolumeClaimCleaner kicks in*
#### Key Metrics
* `last_cluster_reconcile`
* Gauge metric of the last time the `app` (CR name, eg `c-default-xx-01`) was reconciled
* Use this metric to determine if reconciles are occurring regularly
* [Example alertmanager alert definition](#operator-not-reconciling-alert)
* `controller_runtime_reconcile_errors_total`
* Counter metric of the total number of reconciliation errors per controller
* Use this metric in conjunction with with `controller_runtime_reconcile_total` to determine the error rate of reconciliation
* [Example alertmanager alert definition](#operator-reconciliation-error-alert)
#### Common Issues
##### Changes were made to the CR but they aren't being applied
If ClickhouseCluster CR is not reconciled for a long time.
This probably means either,
1. The operator is **crashlooping**. Check operator log.
2. Clickhouse pods are **crashlooping.** Check **keeper and server pods** to find reason why it's happening
3. **clickhouse.com/skip-reconcile** annotation in the CR.
##### Drop a server replica
Use thisif you want to remove a replica from the cluster without scaling in the cluster.
###### Add skip-reconcile
```
kubectl annotate clickhousecluster c-default-xx-01 -n ns-default-xx-01 clickhouse.com/skip-reconcile=remove-replica
```
You can use any value here. We use remove-replica as an example. Confirm that the operator has noticed this annotation. You should see this in operator logs.
```
kubectl logs -f -n clickhouse-operator-system operator-clickhouse-operator-helm-5576dd598b-sqhxh
```
`Skip ClickhouseCluster reconcile req ... because it has clickhouse.com/skip-reconcile annotation"`
###### Remove From Replica State Map
We are going to remove the replica from the replica-state-map. You can see it being tracked here;
```
kubectl get clickhousecluster c-default-xx-01 -n ns-default-xx-01 -o json |jq .status.replicaStateMap
```
Now edit the status to remove the replica from the replica state map.
```
EDITOR=vim kubectl edit clickhousecluster c-default-xx-01 -n ns-default-xx-01 --subresource=status
```
###### Delete Statefulset
```
kubectl delete sts c-default-xx-01-server-082s2da -n ns-default-xx-01
```
Wait for the pod to terminate after deleting the stateful set.
###### Remove skip-reconcile
```
kubectl annotate clickhousecluster c-default-xx-01 -n ns-default-xx-01 clickhouse.com/skip-reconcile-
```
The operator will launch a new replica and clean up the removed replica from ClickHouse.
###### Verify
Log in to your ClickHouse cluster, and ensure the replica has been removed.
If any leases this replica holds have not expired, the operator will retry removal. It should be cleaned up in 5 minutes.
##### Server pod is hanging from the termination
```
NAME READY STATUS RESTARTS AGE
c-navy-wl-64-keeper-0 1/1 Running 0 3m40s
c-navy-wl-64-keeper-1 1/1 Running 0 3m40s
c-navy-wl-64-keeper-2 1/1 Running 0 3m40s
c-navy-wl-64-server-gbwmanx-0 1/2 Terminating 0 3m25s
c-navy-wl-64-server-pxb9mde-0 1/2 Terminating 0 3m25s
```
So, before terminating server pods, we're trying to drain connections and wait while running requests are completed. For that, we use a PreStop hook that executes some logic.
In that case, you can:
Check **prestop.log**
```
kubectl exec c-navy-wl-64-server-gbwmanx-0 -- cat /var/log/clickhouse-server/prestop.log
```
Check server logs for any received signal log messages
##### Why is the CR not in a healthy "Running" state?
Use kubectl to check Instance statuses
```
kubectl get clickhouseclusters -A
```
Check what is going on with restarting the server Describe pod:
```
kubectl describe pod c-navy-wl-64-server-2 -n ns-navy-wl-64
```
Check logs of the previously terminated pod:
```
kubectl logs -p c-navy-wl-64-server-2 -n ns-navy-wl-64
```
Check events
```
kubectl get events -n ns-navy-wl-64
```
### ClickHouse Server
#### Overview
The clickhouse-server component is the main ClickHouse process that ingests, queries, stores, and processes data.
#### Key Metrics
The [Granfana ClickHouse mixin](https://grafana.com/docs/grafana-cloud/monitor-infrastructure/integrations/integration-reference/integration-clickhouse/) provides access to many ClickHouse metrics in a prebuilt dashboard. Note that there is an existing `prometheus.io/*` set of annotations on the ClickHouse server pods. These will expose some metrics, but will not give you the `ClickHouse_CustomMetrics_*` defined below. You should plan on setting up the `:8123/metrics` Prometheus endpoint as a scrape target on each of the server pods via a PodMonitor or equivalent. This endpoint requires authentication and should be authenticated with a dedicated user with read-only privileges.
* `ClickHouse_CustomMetric_NumberOfBrokenDetachedParts`
* Gauge metric indicating the number of broken detached parts.
* [Example alertmanager alert definition](#broken-detached-parts)
* `ClickHouse_CustomMetric_LostPartCount`
* Gauge metric indicating the number of lost parts which indicates data loss. **False positives are possible.**
* [Example alertmanager alert definition](#data-loss)
* `ClickHouseErrorMetric_*`
* Counter metric indicating number of metrics of given error type.
* [Example `ClickHouseErrorMetric_CANNOT_WRITE_TO_FILE_DESCRIPTOR` alertmanager alert definition](#cannot-write-to-file-descriptor)
* [Example `ClickHouseErrorMetric_CHECKSUM_DOESNT_MATCH` alertmanager alert definition](#checksum-doesn't-match)
* [Example `ClickHouseErrorMetric_CORRUPTED_DATA` alertmanager alert definition](#corrupted-data)
* [Example `ClickHouseErrorMetric_LOGICAL_ERROR` alertmanager alert definition](#logical-errors)
* [Example `ClickHouseErrorMetric_NOT_ENOUGH_DISK_SPACE` alertmanager alert definition](#not-enough-space)
* [Example `ClickHouseErrorMetric_POTENTIALLY_BROKEN_DATA_PART` alertmanager alert definition](#broken-parts-detected-on-select)
* [Example `ClickHouseErrorMetric_REPLICA_ALREADY_EXISTS` alertmanager alert definition](#replica-already-exists)
* `ClickHouseMetrics_IsServerShuttingDown`
* Gauge metric indicating if ClickHouse server is shutting down
* [Example alertmanager alert definition](#clickhouse-server-stuck-shutting-down)
* `ClickHouse_CustomMetric_TableReadOnlyDurationSeconds`
* Timing gauge indicating how long a table has been in READONLY mode.
* [Example alertmanager alert definition](#table-replicas-read-only)
#### Common Issues
##### Crashlooping Server Pods
Check the ClickHouse server pod logs. They should explain why the process is crashing. If it's a result of something like memory pressure and Kubernetes is terminating the pod, check the Kubernetes events for more information.
##### Check CH Metrics with SQL
###### Replication Queue Size per Table.
Trigger: If this number is bigger than 100 for any table, we have to be alerted.
```
SELECT
concat(database, '.', table),
count()
FROM system.replication_queue
GROUP BY
database,
table
```
Another way to do it:
```
SELECT
concat(database, '.', table),
queue_size
FROM system.replicas
```
###### Replication Queue Oldest Entry per Table.
Trigger: If this number is older than 1 day, we have to be alerted.
```
SELECT
concat(database, '.', table),
min(create_time)
FROM system.replication_queue
GROUP BY
database,
table
```
### ClickHouse Keeper
#### Overview
The [clickhouse-keeper](https://clickhouse.com/blog/clickhouse-keeper-a-zookeeper-alternative-written-in-cpp#usage-in-clickhouse) component is a ZooKeeper-compatible distributed service that manages the distributed coordination between clickhouse-server replicas and is responsible for storing the metadata of the ClickHouse data. A PodMonitor for `:8001/metrics` should be created for keeper if you wish to capture metrics from keeper pods.
#### Key Metrics
TODO
#### Common Issues
##### High ZNode Count
TODO
### Alerting
In general, standard alerts should be set for things like crashlooping pods, unschedulable pods, and other infrastructure-related issues that may be particular to your environment. Below are examples of recommended alerting on the various components mentioned above.
#### Operator
##### Operator not reconciling Alert
```
alert: ClickhouseOperatorNotReconciling
expr: avg(increase(last_cluster_reconcile[90m])) by (app) == 0
for: 120m
```
**Purpose:** Alerts when the operator has not reconciled within the specified amount of time
**Action:** Check that operator is running and healthy. Check operator logs to see what is preventing reconciliation. Also verify that there is not a `clickhouse.com/skip-reconcile` annotation your CRs as described [here](#changes-were-made-to-the-cr-but-they-aren't-being-applied).
##### Operator reconciliation error Alert
```
alert: ClickhouseOperatorReconcileErrors
expr: |
(
sum(rate(controller_runtime_reconcile_errors_total{namespace="clickhouse-operator-system"}[5m])) by (controller, namespace)
/
sum(rate(controller_runtime_reconcile_total{namespace="clickhouse-operator-system"}[5m])) by (controller, namespace)
) > 0.05
for: 15m
```
**Purpose:** Alerts when reconciliation errors pass more than 5% of reconciliation attempts.
**Action:** Check operator logs for error messages to find the underlying cause.
#### ClickHouse Server
##### Broken Detached Parts
```
alert: ClickHouseBrokenDetachedParts
expr: ClickHouse_CustomMetric_NumberOfBrokenDetachedParts > 100
for: 60m
```
**Purpose:** Triggered when the number of broken detached parts has been more than 100 for at least 60 minutes.
**Action:**
If shared merge tree/replicated merge tree data parts are genuinely broken, [ClickHouseDataLoss](#data-loss) should also be triggered.
For tables with the Local metadata type (i.e., `s3disk` or `s3diskWithCache`), having some small number of broken detached parts **may not always indicate an incident** because we may create files for parts but not have time to write to them during hard restarts. Hence, the 100 threshold.
**Mitigation:**
First, wait some time to see if [ClickHouseDataLoss](#data-loss) has been triggered. If ClickHouseDataLoss has been triggered, proceed with investigating and mitigating it instead and, once fixed, verify that there are no more broken detached parts. Otherwise, reach out to ClickHouse support.
##### Data Loss
```
alert: ClickHouseDataLoss
expr: ClickHouse_CustomMetric_LostPartCount > 0
for: 30m -- want a larger window to reduce false positives
```
**Purpose:** Indicates potential data loss, requires investigation to confirm.
**Action:** Contact ClickHouse support. You can do some initial investigation with the following steps.
###### Understanding what data parts are lost
The alert for data loss uses lost\_part\_count in system.replicas table. To understand how many parts were lost and in which tables you can use the following query:
```
SELECT
database,
table,
lost_part_count AS value
FROM system.replicas
WHERE value > 0
```
Now we need to find what data parts ClickHouse considers as lost forever. To do so, you need to find logs like `Part * is lost forever`.
If you're investigating a possible data loss that happened a long time ago, you should also look for logs like Dropping table with non-zero lost\_part\_count equal to {}.
###### Finding logs related to lost parts
There are several options where you can check logs:
1. `/var/log/clickhouse-server/` directory on the pod contains archives with the most recent logs. You can use zgrep to lookup for log messages. If there is a lot of activity on ClickHouse server log files may rotate very fast.
2. system.text\_log table. TTL for this table on the cloud is 30 days.
You may use the following SQL query:
```
SELECT
hostName(),
event_time,
logger_name,
message
FROM clusterAllReplicas(default, system.text_log)
WHERE message_format_string = 'Part {} is lost forever.'
ORDER BY hostName(), event_time
```
You may add a predicate for event\_time range to make the query faster.
###### Understanding the history of the lost parts
After collecting the list of lost parts the next step is to understand what happened to these parts.
Pick any data part from the list. Find all logs related to it:
```
SELECT
event_time,
message
FROM system.text_log
WHERE message LIKE '%%' AND hostName() = ''
ORDER BY event_time ASC
```
Check what happened before the log message `Part * is lost forever`. Note: All log messages after part is lost forever are irrelevant (so if you see that the part was finally found on some replica - it's actually an empty part that was created to replace the lost one).
Check if the part should have been dropped anyway (in that case there is a high chance of a false positive):
1. Check if the table has TTL, and check if the lost part should have been dropped anyway due to TTL.
2. Check system.query\_log if there were TRUNCATE or DROP PARTITION queries that should have dropped the lost parts.
Other things to investigate:
1. If the part was detached as broken - try to figure out why it was broken.
2. If you see The specified key does not exist, you should search for all logs with the blob name, and find when it was removed and why. Also, check log messages about zero-copy locks.
If all `part is lost forever` errors on the instance happened in the same table around the same time, it highly likely has the same reason. If not, pick a part from another group, and repeat (it might be lost for a different reason).
##### Cannot Write to File Descriptor
```
alert: ClickHouseCannotWriteToFileDescriptor
expr: |
increase(ClickHouseErrorMetric_CANNOT_READ_FROM_FILE_DESCRIPTOR[30s]) > 0
or (
ClickHouseErrorMetric_CANNOT_READ_FROM_FILE_DESCRIPTOR > 0
and
ignoring (table) ClickHouseAsyncMetrics_Uptime < 3 * 60 * 60
)
```
**Purpose:** This alert mostly indicates a full cache disk (and consequently "no space left on device" or "CANNOT\_WRITE\_TO\_FILE\_DESCRIPTOR" errors).
**Action:** Reasons can be misconfiguration and bugs in clickhouse. If your node size or type has recently changed, it may be related to a misconfiguration. Please reach out to ClickHouse support in either case.
##### Checksum Doesn't Match
```
alert: ClickHouseChecksumsMismatch
expr: |
increase(ClickHouseErrorMetric_CHECKSUM_DOESNT_MATCH[30s]) > 0
or (
ClickHouseErrorMetric_CHECKSUM_DOESNT_MATCH > 0
and
ignoring (table) ClickHouseAsyncMetrics_Uptime < 3 * 60 * 60
)
```
**Purpose**
**:** Checksums of some dataparts don't match. If this happens after the upgrade it may indicate to a bug in the codebase.
**Action**: Please reach out to ClickHouse support.
##### Corrupted Data
```
alert: ClickHouseCorruptedData
expr: |
increase(ClickHouseErrorMetric_CORRUPTED_DATA[30s]) > 0
or (
ClickHouseErrorMetric_CORRUPTED_DATA > 0
and
ignoring (table) ClickHouseAsyncMetrics_Uptime < 3 * 60 * 60
)
```
**Purpose:** Some data parts are corrupted. If this happens after the upgrade it may indicate to a bug in the codebase.
**Action:** Please reach out to ClickHouse support.
##### Logical Errors
```
alert: ClickHouseLogicalErrors
expr: |
increase(ClickHouseErrorMetric_LOGICAL_ERROR[30s]) > 0
or (
ClickHouseErrorMetric_LOGICAL_ERROR > 0
and
ignoring (table) ClickHouseAsyncMetrics_Uptime < 3 * 60 * 60
)
```
**Purpose:** Logical errors occurred in ClickHouse. This is often a bug in the codebase.
**Action:** Please reach out to ClickHouse support
##### Not Enough Space
```
alert: ClickHouseNotEnoughSpaceErrors
expr: |
increase(ClickHouseErrorMetric_NOT_ENOUGH_SPACE[30s]) > 0
or (
ClickHouseErrorMetric_NOT_ENOUGH_SPACE > 0
and
ignoring (table) ClickHouseAsyncMetrics_Uptime < 3 * 60 * 60
)
```
**Purpose:** Server emitted NOT\_ENOUGH\_SPACE errors. This could indicate that a PVC is full, there is a misconfiguration, ClickHouse tried to reserve a large block for temporary data and was rejected, or something else.
**Action:** Please reach out to ClickHouse support.
##### Broken Parts Detected on Select
```
alert: ClickHouseBrokenPartDetectedOnSelect
expr: |
increase(ClickHouseErrorMetric_POTENTIALLY_BROKEN_DATA_PART[30s]) > 0
or (
ClickHouseErrorMetric_POTENTIALLY_BROKEN_DATA_PART > 0
and
ignoring (table) ClickHouseAsyncMetrics_Uptime < 3 * 60 * 60
)
```
**Purpose:** Select failed because of the POTENTIALLY\_BROKEN\_DATA\_PART error. This indicates a data loss.
**Action:** See [Data Loss](#data-loss) action and reach out to ClickHouse support.
##### Replica Already Exists
```
alert: ClickHouseReplicaAlreadyExists
expr: |
increase(ClickHouseErrorMetric_REPLICA_ALREADY_EXISTS[30s]) > 0
or (
ClickHouseErrorMetric_REPLICA_ALREADY_EXISTS > 0
and
ignoring (table) ClickHouseAsyncMetrics_Uptime < 3 * 60 * 60
)
```
**Purpose:** Replica creation failed due to already existing replica. This is usually a bug in the Replicated database engine.
**Action:** Please reach out to ClickHouse support.
##### ClickHouse server Stuck Shutting Down
```
alert: ClickHouseServerShutdownStuck
expr: ClickHouseMetrics_IsServerShuttingDown == 1
for: 70m
```
**Purpose:** ClickHouse server has been shutting down for over an hour.
**Action:** Check the threads via system.stack\_trace or GDB.
##### Table Replicas Read Only
```
alert: ClickHouseTableReplicasReadOnly
expr: ClickHouse_CustomMetric_TableReadOnlyDurationSeconds > 3600
```
**Purpose:** Table has been readonly for more than an hour.
**Action**: Check server logs filtered by affected table name(s) to see why it is in readonly mode. This could also indicate a keeper issue. Check keeper logs for potential issues.
### Incident Runbooks
#### Data loss/corruption. ClickHouseBrokenPartDetectedOnSelect
##### Reason
`ClickHouseBrokenPartDetectedOnSelect` is triggered when SMT data part read fails with a (probably) non-retriable error.
The alert is triggered when the `POTENTIALLY_BROKEN_DATA_PART` exception is thrown.
##### Mitigation
Examine the logs for the `POTENTIALLY_BROKEN_DATA_PART` exception. If the alert has been triggered, it must be there. If it is not there for some reason, you may also check `system.errors`.
It should then be apparent what exactly went wrong from the exception message and the stack trace.
#### SMT. ClickHouseTableReplicasReadOnly
##### Reason
`ClickHouseTableReplicasReadOnly` is triggered if a table has been in read-only for at least one hour.
This now excludes tables in `*_broken_replicated_tables` and `*_broken_tables` databases.
Could be a `DROP` gone badly.
##### Mitigation
Check if there are still read-only tables anywhere in the cluster:
```sql theme={null}
SELECT
readonly_duration,
database,
table,
hostname()
FROM clusterAllReplicas(default, system.replicas)
WHERE readonly_start_time IS NOT NULL
```
Typically, having such tables indicates that we ran `StorageSharedMergeTree::shutdown` but for some reason decided to keep the storage object and not destruct it. To confirm / investigate the reason for this, you can search the text logs with logger name as table name.
Sometimes the problem is trivial and can be fixed with a simple replica restart.
First, try running [SYSTEM RESTART REPLICA](/core/reference/statements/system#restart-replica) for the affected tables. You can get the table names from the query mentioned above.
#### SMT. ClickHouseReplicaAlreadyExists
##### Reason
`ClickHouseReplicaAlreadyExists` is triggered whenever an exception with the `REPLICA_ALREADY_EXISTS` error occurs on the instance.
Such exceptions occur when we fail to create a replica of a replicated table (SMT or RMT) because an existing replica is already associated with the path.
##### Mitigation
This is unlikely to be caused by a user error. In the past, the user could try to create two tables using the same ZooKeeper path. But now we prohibit such behaviour by using the `database_replicated_allow_explicit_uuid`
This is likely to be a bug in the Replicated database or Shared Catalog.
#### Misc. ClickHouseCannotWriteToFileDescriptor
##### Reason
`ClickHouseCannotWriteToFileDescriptor` is triggered when an exception with the `CANNOT_WRITE_TO_FILE_DESCRIPTOR` error occurs on the instance.
The exception is thrown when there is not enough space on the cache disk for a new cache entry or for external data processing (e.g., external aggregation, external joins).
There is a misconfiguration issue and a disk w with less space than was created with less space than was requested in the CR config.
##### Mitigation
**Important:** There is a known issue with tracking the cache disk usage if the `join_algorithm = 'partial_merge'` query setting is specified. So check on this first.
To confirm if the issue is in misconfiguration or in disk usage tracking, do the following:
1. Run `kubectl exec -n -it -- /bin/bash` to connect to the pod.
2. Run `df -h` to see the cache disk size.
3. Run `select path, max_size from system.filesystem_cache_settings` to see the required cache disk size. Note that we normally have different caches (e.g., `s3diskWithCache`, `diskPlainRewritableForSystemTablesWithCache`) sharing the same path (i.e., `/mnt/clickhouse-cache/sharedS3DiskCache`).
4. If the actual disk size is smaller, the issue is in misconfiguration. Reach out to the Data Plane Operator team.
5. Otherwise, it's likely a bug in tracking the cache disk usage. To investigate this, you can try searching through `system.filesystem_cache`.
###### ReplicaStateMap - How multiple statefulsets are tracked
MultiSTS replicas cannot rely on ordinals as a deterministic way to understand a pod's age / lifecycle. Because we need a way to track the state of each statefulset, we store this inside a map as part of the CR's status.
A sample replicaStateMap can look like following:
```
❯ kubectl get clickhousecluster c-navy-wl-64 -o yaml | yq .status
replicaStateMap:
c-navy-wl-64-server-5hvvzxe:
createdAt: "2023-08-03T13:25:40Z"
isBackupPod: true
state: Pending
updatedAt: "2023-08-03T13:25:40Z"
c-navy-wl-64-server-fvnytjb:
createdAt: "2023-08-03T13:25:40Z"
state: Pending
updatedAt: "2023-08-03T13:25:40Z"
c-navy-wl-64-server-un85gpo:
createdAt: "2023-08-03T13:25:40Z"
state: Pending
updatedAt: "2023-08-03T13:25:40Z"
```
* The state can be **Pending**, **Ready**, **Stopped** or **Condemned**.
* ReplicaStateMap also marks 1 pod at any given time as the pod for which **IsBackupPod** will be true. Predictably, this pod is where backup will run.
* A **backup** replica is never marked as **Condemned**
* Once a replica's name gets added to the map, the operator will ensure it goes from **Pending** to **Ready** state.
*WARNING: Additionally, the state tracking built inside the map is only for the operator's internal state management and should not be used by external components.*
###### Parallel vs Rolling Reconciliation
The operator will do Parallel Pod Management if the only change in StatefulSet spec has to do with changing replica count.
If the statefulset specs require something other than resizing of replica count, then we no longer rely on parallel pod management. A second upgrade loop kicks in.
The upgrade loop will look at the PDB (maxUnavailable) and start reconciling statefulsets one-by-one. It will ensure we never exceed the disruption budget.
###### Horizontal Scaling in MultiSTS mode
Scaling Out in MultiSTS mode is simple. As soon as a new replica name gets added to the ReplicaStateMap, the operator will ensure that StatefulSet gets created and reconciled. Subsequent reconcile loops will ensure that the newly created replica is up-to-date.
Scaling In is quite involved and complex. Because a replica which is caling in might still be receiving traffic, we follow multiple steps to ensure the replica scales in.
**Condemned Replicas**
We introduce the concept of a Condemned Replica. When the actual replica count has exceeded the desired count, it means we need to scale in. The replicas that get marked for deletion are **condemned** replicas. We change their state from **Ready** to **Condemned** inside the **ReplicaStateMap**. This ensures that further down the line, we remember which replicas we need to safely delete and remove from the map.
**Scale-In**
Now that we understand condemned replicas, here is the flow of Scaling In:
1. Remove the Topology Key (so this replica is no longer part of our TopologySpreadConstraint's Skew calculations).
2. Make sure all statefulsets are in **Ready**. If not, we will not scaleIn (and continue to re-queue).
3. Execute **SYSTEM SYNC REPLICA** $database.$table LIGHTWEIGHT for each replicated db for each table. *Note: This command is executed on the replica marked for backups (since that replica is never condemned).*
4. **Delete** the **condemned statefulsets**, and remove them from the ReplicaStateMap.
5. Execute **SYSTEM DROP REPLICA** \$replicaName on Ready replicas to remove their information from Keeper.
*Note: Because we have removed replicas from ReplicaStateMap, we query ClickHouse to get the set of all known replicas and only then drop the ones we need to.*
*Label the PVCs for the deleted statefulsets with clickhouse.com/delete-pvc. This is PVC Leaking.*
*This is where the operator's responsibility ends and the PersistentVolumeClaimCleaner kicks in*
#### Key Metrics
* `last_cluster_reconcile`
* Gauge metric of the last time the `app` (CR name, eg `c-default-xx-01`) was reconciled
* Use this metric to determine if reconciles are occurring regularly
* [Example alertmanager alert definition](#operator-not-reconciling-alert)
* `controller_runtime_reconcile_errors_total`
* Counter metric of the total number of reconciliation errors per controller
* Use this metric in conjunction with with `controller_runtime_reconcile_total` to determine the error rate of reconciliation
* [Example alertmanager alert definition](#operator-reconciliation-error-alert)
#### Common Issues
##### Changes were made to the CR but they aren't being applied
If ClickhouseCluster CR is not reconciled for a long time.
This probably means either,
1. The operator is **crashlooping**. Check operator log.
2. Clickhouse pods are **crashlooping.** Check **keeper and server pods** to find reason why it's happening
3. **clickhouse.com/skip-reconcile** annotation in the CR.
##### Drop a server replica
Use thisif you want to remove a replica from the cluster without scaling in the cluster.
###### Add skip-reconcile
```
kubectl annotate clickhousecluster c-default-xx-01 -n ns-default-xx-01 clickhouse.com/skip-reconcile=remove-replica
```
You can use any value here. We use remove-replica as an example. Confirm that the operator has noticed this annotation. You should see this in operator logs.
```
kubectl logs -f -n clickhouse-operator-system operator-clickhouse-operator-helm-5576dd598b-sqhxh
```
`Skip ClickhouseCluster reconcile req ... because it has clickhouse.com/skip-reconcile annotation"`
###### Remove From Replica State Map
We are going to remove the replica from the replica-state-map. You can see it being tracked here;
```
kubectl get clickhousecluster c-default-xx-01 -n ns-default-xx-01 -o json |jq .status.replicaStateMap
```
Now edit the status to remove the replica from the replica state map.
```
EDITOR=vim kubectl edit clickhousecluster c-default-xx-01 -n ns-default-xx-01 --subresource=status
```
###### Delete Statefulset
```
kubectl delete sts c-default-xx-01-server-082s2da -n ns-default-xx-01
```
Wait for the pod to terminate after deleting the stateful set.
###### Remove skip-reconcile
```
kubectl annotate clickhousecluster c-default-xx-01 -n ns-default-xx-01 clickhouse.com/skip-reconcile-
```
The operator will launch a new replica and clean up the removed replica from ClickHouse.
###### Verify
Log in to your ClickHouse cluster, and ensure the replica has been removed.
If any leases this replica holds have not expired, the operator will retry removal. It should be cleaned up in 5 minutes.
##### Server pod is hanging from the termination
```
NAME READY STATUS RESTARTS AGE
c-navy-wl-64-keeper-0 1/1 Running 0 3m40s
c-navy-wl-64-keeper-1 1/1 Running 0 3m40s
c-navy-wl-64-keeper-2 1/1 Running 0 3m40s
c-navy-wl-64-server-gbwmanx-0 1/2 Terminating 0 3m25s
c-navy-wl-64-server-pxb9mde-0 1/2 Terminating 0 3m25s
```
So, before terminating server pods, we're trying to drain connections and wait while running requests are completed. For that, we use a PreStop hook that executes some logic.
In that case, you can:
Check **prestop.log**
```
kubectl exec c-navy-wl-64-server-gbwmanx-0 -- cat /var/log/clickhouse-server/prestop.log
```
Check server logs for any received signal log messages
##### Why is the CR not in a healthy "Running" state?
Use kubectl to check Instance statuses
```
kubectl get clickhouseclusters -A
```
Check what is going on with restarting the server Describe pod:
```
kubectl describe pod c-navy-wl-64-server-2 -n ns-navy-wl-64
```
Check logs of the previously terminated pod:
```
kubectl logs -p c-navy-wl-64-server-2 -n ns-navy-wl-64
```
Check events
```
kubectl get events -n ns-navy-wl-64
```
### ClickHouse Server
#### Overview
The clickhouse-server component is the main ClickHouse process that ingests, queries, stores, and processes data.
#### Key Metrics
The [Granfana ClickHouse mixin](https://grafana.com/docs/grafana-cloud/monitor-infrastructure/integrations/integration-reference/integration-clickhouse/) provides access to many ClickHouse metrics in a prebuilt dashboard. Note that there is an existing `prometheus.io/*` set of annotations on the ClickHouse server pods. These will expose some metrics, but will not give you the `ClickHouse_CustomMetrics_*` defined below. You should plan on setting up the `:8123/metrics` Prometheus endpoint as a scrape target on each of the server pods via a PodMonitor or equivalent. This endpoint requires authentication and should be authenticated with a dedicated user with read-only privileges.
* `ClickHouse_CustomMetric_NumberOfBrokenDetachedParts`
* Gauge metric indicating the number of broken detached parts.
* [Example alertmanager alert definition](#broken-detached-parts)
* `ClickHouse_CustomMetric_LostPartCount`
* Gauge metric indicating the number of lost parts which indicates data loss. **False positives are possible.**
* [Example alertmanager alert definition](#data-loss)
* `ClickHouseErrorMetric_*`
* Counter metric indicating number of metrics of given error type.
* [Example `ClickHouseErrorMetric_CANNOT_WRITE_TO_FILE_DESCRIPTOR` alertmanager alert definition](#cannot-write-to-file-descriptor)
* [Example `ClickHouseErrorMetric_CHECKSUM_DOESNT_MATCH` alertmanager alert definition](#checksum-doesn't-match)
* [Example `ClickHouseErrorMetric_CORRUPTED_DATA` alertmanager alert definition](#corrupted-data)
* [Example `ClickHouseErrorMetric_LOGICAL_ERROR` alertmanager alert definition](#logical-errors)
* [Example `ClickHouseErrorMetric_NOT_ENOUGH_DISK_SPACE` alertmanager alert definition](#not-enough-space)
* [Example `ClickHouseErrorMetric_POTENTIALLY_BROKEN_DATA_PART` alertmanager alert definition](#broken-parts-detected-on-select)
* [Example `ClickHouseErrorMetric_REPLICA_ALREADY_EXISTS` alertmanager alert definition](#replica-already-exists)
* `ClickHouseMetrics_IsServerShuttingDown`
* Gauge metric indicating if ClickHouse server is shutting down
* [Example alertmanager alert definition](#clickhouse-server-stuck-shutting-down)
* `ClickHouse_CustomMetric_TableReadOnlyDurationSeconds`
* Timing gauge indicating how long a table has been in READONLY mode.
* [Example alertmanager alert definition](#table-replicas-read-only)
#### Common Issues
##### Crashlooping Server Pods
Check the ClickHouse server pod logs. They should explain why the process is crashing. If it's a result of something like memory pressure and Kubernetes is terminating the pod, check the Kubernetes events for more information.
##### Check CH Metrics with SQL
###### Replication Queue Size per Table.
Trigger: If this number is bigger than 100 for any table, we have to be alerted.
```
SELECT
concat(database, '.', table),
count()
FROM system.replication_queue
GROUP BY
database,
table
```
Another way to do it:
```
SELECT
concat(database, '.', table),
queue_size
FROM system.replicas
```
###### Replication Queue Oldest Entry per Table.
Trigger: If this number is older than 1 day, we have to be alerted.
```
SELECT
concat(database, '.', table),
min(create_time)
FROM system.replication_queue
GROUP BY
database,
table
```
### ClickHouse Keeper
#### Overview
The [clickhouse-keeper](https://clickhouse.com/blog/clickhouse-keeper-a-zookeeper-alternative-written-in-cpp#usage-in-clickhouse) component is a ZooKeeper-compatible distributed service that manages the distributed coordination between clickhouse-server replicas and is responsible for storing the metadata of the ClickHouse data. A PodMonitor for `:8001/metrics` should be created for keeper if you wish to capture metrics from keeper pods.
#### Key Metrics
TODO
#### Common Issues
##### High ZNode Count
TODO
### Alerting
In general, standard alerts should be set for things like crashlooping pods, unschedulable pods, and other infrastructure-related issues that may be particular to your environment. Below are examples of recommended alerting on the various components mentioned above.
#### Operator
##### Operator not reconciling Alert
```
alert: ClickhouseOperatorNotReconciling
expr: avg(increase(last_cluster_reconcile[90m])) by (app) == 0
for: 120m
```
**Purpose:** Alerts when the operator has not reconciled within the specified amount of time
**Action:** Check that operator is running and healthy. Check operator logs to see what is preventing reconciliation. Also verify that there is not a `clickhouse.com/skip-reconcile` annotation your CRs as described [here](#changes-were-made-to-the-cr-but-they-aren't-being-applied).
##### Operator reconciliation error Alert
```
alert: ClickhouseOperatorReconcileErrors
expr: |
(
sum(rate(controller_runtime_reconcile_errors_total{namespace="clickhouse-operator-system"}[5m])) by (controller, namespace)
/
sum(rate(controller_runtime_reconcile_total{namespace="clickhouse-operator-system"}[5m])) by (controller, namespace)
) > 0.05
for: 15m
```
**Purpose:** Alerts when reconciliation errors pass more than 5% of reconciliation attempts.
**Action:** Check operator logs for error messages to find the underlying cause.
#### ClickHouse Server
##### Broken Detached Parts
```
alert: ClickHouseBrokenDetachedParts
expr: ClickHouse_CustomMetric_NumberOfBrokenDetachedParts > 100
for: 60m
```
**Purpose:** Triggered when the number of broken detached parts has been more than 100 for at least 60 minutes.
**Action:**
If shared merge tree/replicated merge tree data parts are genuinely broken, [ClickHouseDataLoss](#data-loss) should also be triggered.
For tables with the Local metadata type (i.e., `s3disk` or `s3diskWithCache`), having some small number of broken detached parts **may not always indicate an incident** because we may create files for parts but not have time to write to them during hard restarts. Hence, the 100 threshold.
**Mitigation:**
First, wait some time to see if [ClickHouseDataLoss](#data-loss) has been triggered. If ClickHouseDataLoss has been triggered, proceed with investigating and mitigating it instead and, once fixed, verify that there are no more broken detached parts. Otherwise, reach out to ClickHouse support.
##### Data Loss
```
alert: ClickHouseDataLoss
expr: ClickHouse_CustomMetric_LostPartCount > 0
for: 30m -- want a larger window to reduce false positives
```
**Purpose:** Indicates potential data loss, requires investigation to confirm.
**Action:** Contact ClickHouse support. You can do some initial investigation with the following steps.
###### Understanding what data parts are lost
The alert for data loss uses lost\_part\_count in system.replicas table. To understand how many parts were lost and in which tables you can use the following query:
```
SELECT
database,
table,
lost_part_count AS value
FROM system.replicas
WHERE value > 0
```
Now we need to find what data parts ClickHouse considers as lost forever. To do so, you need to find logs like `Part * is lost forever`.
If you're investigating a possible data loss that happened a long time ago, you should also look for logs like Dropping table with non-zero lost\_part\_count equal to {}.
###### Finding logs related to lost parts
There are several options where you can check logs:
1. `/var/log/clickhouse-server/` directory on the pod contains archives with the most recent logs. You can use zgrep to lookup for log messages. If there is a lot of activity on ClickHouse server log files may rotate very fast.
2. system.text\_log table. TTL for this table on the cloud is 30 days.
You may use the following SQL query:
```
SELECT
hostName(),
event_time,
logger_name,
message
FROM clusterAllReplicas(default, system.text_log)
WHERE message_format_string = 'Part {} is lost forever.'
ORDER BY hostName(), event_time
```
You may add a predicate for event\_time range to make the query faster.
###### Understanding the history of the lost parts
After collecting the list of lost parts the next step is to understand what happened to these parts.
Pick any data part from the list. Find all logs related to it:
```
SELECT
event_time,
message
FROM system.text_log
WHERE message LIKE '%%' AND hostName() = ''
ORDER BY event_time ASC
```
Check what happened before the log message `Part * is lost forever`. Note: All log messages after part is lost forever are irrelevant (so if you see that the part was finally found on some replica - it's actually an empty part that was created to replace the lost one).
Check if the part should have been dropped anyway (in that case there is a high chance of a false positive):
1. Check if the table has TTL, and check if the lost part should have been dropped anyway due to TTL.
2. Check system.query\_log if there were TRUNCATE or DROP PARTITION queries that should have dropped the lost parts.
Other things to investigate:
1. If the part was detached as broken - try to figure out why it was broken.
2. If you see The specified key does not exist, you should search for all logs with the blob name, and find when it was removed and why. Also, check log messages about zero-copy locks.
If all `part is lost forever` errors on the instance happened in the same table around the same time, it highly likely has the same reason. If not, pick a part from another group, and repeat (it might be lost for a different reason).
##### Cannot Write to File Descriptor
```
alert: ClickHouseCannotWriteToFileDescriptor
expr: |
increase(ClickHouseErrorMetric_CANNOT_READ_FROM_FILE_DESCRIPTOR[30s]) > 0
or (
ClickHouseErrorMetric_CANNOT_READ_FROM_FILE_DESCRIPTOR > 0
and
ignoring (table) ClickHouseAsyncMetrics_Uptime < 3 * 60 * 60
)
```
**Purpose:** This alert mostly indicates a full cache disk (and consequently "no space left on device" or "CANNOT\_WRITE\_TO\_FILE\_DESCRIPTOR" errors).
**Action:** Reasons can be misconfiguration and bugs in clickhouse. If your node size or type has recently changed, it may be related to a misconfiguration. Please reach out to ClickHouse support in either case.
##### Checksum Doesn't Match
```
alert: ClickHouseChecksumsMismatch
expr: |
increase(ClickHouseErrorMetric_CHECKSUM_DOESNT_MATCH[30s]) > 0
or (
ClickHouseErrorMetric_CHECKSUM_DOESNT_MATCH > 0
and
ignoring (table) ClickHouseAsyncMetrics_Uptime < 3 * 60 * 60
)
```
**Purpose**
**:** Checksums of some dataparts don't match. If this happens after the upgrade it may indicate to a bug in the codebase.
**Action**: Please reach out to ClickHouse support.
##### Corrupted Data
```
alert: ClickHouseCorruptedData
expr: |
increase(ClickHouseErrorMetric_CORRUPTED_DATA[30s]) > 0
or (
ClickHouseErrorMetric_CORRUPTED_DATA > 0
and
ignoring (table) ClickHouseAsyncMetrics_Uptime < 3 * 60 * 60
)
```
**Purpose:** Some data parts are corrupted. If this happens after the upgrade it may indicate to a bug in the codebase.
**Action:** Please reach out to ClickHouse support.
##### Logical Errors
```
alert: ClickHouseLogicalErrors
expr: |
increase(ClickHouseErrorMetric_LOGICAL_ERROR[30s]) > 0
or (
ClickHouseErrorMetric_LOGICAL_ERROR > 0
and
ignoring (table) ClickHouseAsyncMetrics_Uptime < 3 * 60 * 60
)
```
**Purpose:** Logical errors occurred in ClickHouse. This is often a bug in the codebase.
**Action:** Please reach out to ClickHouse support
##### Not Enough Space
```
alert: ClickHouseNotEnoughSpaceErrors
expr: |
increase(ClickHouseErrorMetric_NOT_ENOUGH_SPACE[30s]) > 0
or (
ClickHouseErrorMetric_NOT_ENOUGH_SPACE > 0
and
ignoring (table) ClickHouseAsyncMetrics_Uptime < 3 * 60 * 60
)
```
**Purpose:** Server emitted NOT\_ENOUGH\_SPACE errors. This could indicate that a PVC is full, there is a misconfiguration, ClickHouse tried to reserve a large block for temporary data and was rejected, or something else.
**Action:** Please reach out to ClickHouse support.
##### Broken Parts Detected on Select
```
alert: ClickHouseBrokenPartDetectedOnSelect
expr: |
increase(ClickHouseErrorMetric_POTENTIALLY_BROKEN_DATA_PART[30s]) > 0
or (
ClickHouseErrorMetric_POTENTIALLY_BROKEN_DATA_PART > 0
and
ignoring (table) ClickHouseAsyncMetrics_Uptime < 3 * 60 * 60
)
```
**Purpose:** Select failed because of the POTENTIALLY\_BROKEN\_DATA\_PART error. This indicates a data loss.
**Action:** See [Data Loss](#data-loss) action and reach out to ClickHouse support.
##### Replica Already Exists
```
alert: ClickHouseReplicaAlreadyExists
expr: |
increase(ClickHouseErrorMetric_REPLICA_ALREADY_EXISTS[30s]) > 0
or (
ClickHouseErrorMetric_REPLICA_ALREADY_EXISTS > 0
and
ignoring (table) ClickHouseAsyncMetrics_Uptime < 3 * 60 * 60
)
```
**Purpose:** Replica creation failed due to already existing replica. This is usually a bug in the Replicated database engine.
**Action:** Please reach out to ClickHouse support.
##### ClickHouse server Stuck Shutting Down
```
alert: ClickHouseServerShutdownStuck
expr: ClickHouseMetrics_IsServerShuttingDown == 1
for: 70m
```
**Purpose:** ClickHouse server has been shutting down for over an hour.
**Action:** Check the threads via system.stack\_trace or GDB.
##### Table Replicas Read Only
```
alert: ClickHouseTableReplicasReadOnly
expr: ClickHouse_CustomMetric_TableReadOnlyDurationSeconds > 3600
```
**Purpose:** Table has been readonly for more than an hour.
**Action**: Check server logs filtered by affected table name(s) to see why it is in readonly mode. This could also indicate a keeper issue. Check keeper logs for potential issues.
### Incident Runbooks
#### Data loss/corruption. ClickHouseBrokenPartDetectedOnSelect
##### Reason
`ClickHouseBrokenPartDetectedOnSelect` is triggered when SMT data part read fails with a (probably) non-retriable error.
The alert is triggered when the `POTENTIALLY_BROKEN_DATA_PART` exception is thrown.
##### Mitigation
Examine the logs for the `POTENTIALLY_BROKEN_DATA_PART` exception. If the alert has been triggered, it must be there. If it is not there for some reason, you may also check `system.errors`.
It should then be apparent what exactly went wrong from the exception message and the stack trace.
#### SMT. ClickHouseTableReplicasReadOnly
##### Reason
`ClickHouseTableReplicasReadOnly` is triggered if a table has been in read-only for at least one hour.
This now excludes tables in `*_broken_replicated_tables` and `*_broken_tables` databases.
Could be a `DROP` gone badly.
##### Mitigation
Check if there are still read-only tables anywhere in the cluster:
```sql theme={null}
SELECT
readonly_duration,
database,
table,
hostname()
FROM clusterAllReplicas(default, system.replicas)
WHERE readonly_start_time IS NOT NULL
```
Typically, having such tables indicates that we ran `StorageSharedMergeTree::shutdown` but for some reason decided to keep the storage object and not destruct it. To confirm / investigate the reason for this, you can search the text logs with logger name as table name.
Sometimes the problem is trivial and can be fixed with a simple replica restart.
First, try running [SYSTEM RESTART REPLICA](/core/reference/statements/system#restart-replica) for the affected tables. You can get the table names from the query mentioned above.
#### SMT. ClickHouseReplicaAlreadyExists
##### Reason
`ClickHouseReplicaAlreadyExists` is triggered whenever an exception with the `REPLICA_ALREADY_EXISTS` error occurs on the instance.
Such exceptions occur when we fail to create a replica of a replicated table (SMT or RMT) because an existing replica is already associated with the path.
##### Mitigation
This is unlikely to be caused by a user error. In the past, the user could try to create two tables using the same ZooKeeper path. But now we prohibit such behaviour by using the `database_replicated_allow_explicit_uuid`
This is likely to be a bug in the Replicated database or Shared Catalog.
#### Misc. ClickHouseCannotWriteToFileDescriptor
##### Reason
`ClickHouseCannotWriteToFileDescriptor` is triggered when an exception with the `CANNOT_WRITE_TO_FILE_DESCRIPTOR` error occurs on the instance.
The exception is thrown when there is not enough space on the cache disk for a new cache entry or for external data processing (e.g., external aggregation, external joins).
There is a misconfiguration issue and a disk w with less space than was created with less space than was requested in the CR config.
##### Mitigation
**Important:** There is a known issue with tracking the cache disk usage if the `join_algorithm = 'partial_merge'` query setting is specified. So check on this first.
To confirm if the issue is in misconfiguration or in disk usage tracking, do the following:
1. Run `kubectl exec -n -it -- /bin/bash` to connect to the pod.
2. Run `df -h` to see the cache disk size.
3. Run `select path, max_size from system.filesystem_cache_settings` to see the required cache disk size. Note that we normally have different caches (e.g., `s3diskWithCache`, `diskPlainRewritableForSystemTablesWithCache`) sharing the same path (i.e., `/mnt/clickhouse-cache/sharedS3DiskCache`).
4. If the actual disk size is smaller, the issue is in misconfiguration. Reach out to the Data Plane Operator team.
5. Otherwise, it's likely a bug in tracking the cache disk usage. To investigate this, you can try searching through `system.filesystem_cache`.